'/%3E%3C/svg%3E)
'/%3E%3Cpath%20fill='%23b2b2b2'%20d='M241%20382q0%2016%2017%2026%2017%2011%2042%2011t42-11q16-11%2017-26V269H241'/%3E%3Cpath%20fill='%239f7e00'%20d='M241%20379q0%2014%208%2023%209%209%2021%209%2014%200%2021-9%209-9%209-23V269h-59'/%3E%3Cpath%20d='M241%20339v-70h59v110q0%2014-9%2023l-6%205v-68h-15v72q-8%200-14-4v-68zm59%2040c0%2022%2015%2032%2029%2032%2021%200%2030-18%2030-32v-40h-59'/%3E%3Cpath%20fill='%239f7e00'%20d='M266%20277v5h2v12h-3v-5h2v-5h-9v5h2v5h-4v9h3v18h-5v10h34v-10h-5v-18h3v-9h-4v-5h2v-5h-9v5h2v5h-3v-12h2v-5zm42%20101q0%2010%206%2017%206%206%2015%207%2010-1%2016-7%206-7%206-17v-29h-43'/%3E%3Ccircle%20fill='%230044ad'%20cx='329.5'%20cy='372'%20r='6'/%3E%3Cellipse%20fill='%230044ad'%20cx='300'%20cy='340'%20rx='16'%20ry='21'/%3E%3C/svg%3E)

The entity-relationship model (ER model) is the most widely used way of drawing the data in a problem before turning it into a database. Peter Chen proposed it in 1976 and it is still the first step in almost any database design: before thinking about tables or SQL, you decide what needs to be stored and how those things relate to each other.
This guide covers its elements, the types of entities and attributes, the degree and cardinality of relationships, generalization, and a full example to practice with.
The three levels of database design
Designing a database goes through three models, from the one closest to the user to the one closest to the machine:
- Conceptual model. It represents the problem as the people involved understand it, with no technical detail. This is where the entity-relationship model is used.
- Logical model. It translates the conceptual model into a specific type of database. For relational databases, this is the relational model: tables, primary keys and foreign keys.
- Physical model. It is the logical model implemented in a specific database management system (MySQL, PostgreSQL, Oracle…), with its data types, indexes and SQL statements.
Each step builds on the previous one: you analyze the problem and draw the ER model; that model is converted into the relational model; and the relational model is turned into SQL to create the tables.
What the entity-relationship model is
It is a conceptual data model that describes the real world as a set of objects (entities), their properties (attributes) and the associations between them (relationships). It has three features worth remembering:
- It shows which data exists, not what is done with it. It does not describe processes or screens.
- It is independent of the database management system. The same diagram works for MySQL, PostgreSQL or Oracle.
- It ignores performance: no storage space, no execution times. That comes later, in the physical design.
Its goal is to answer the question "what information do we need to store?" with a flexible design, because the queries run against a database change over time, while the meaning of the data usually stays the same.
Basic elements: entity, attribute and relationship
In Chen's notation, each element has its own shape:
| Element | What it is | How it is drawn | Example |
|---|---|---|---|
| Entity | A real-world object that can be told apart from others and about which we want to store information | Rectangle | Customer, Product, Employee |
| Attribute | A property that describes an entity or a relationship | Ellipse connected to its entity | Name, Email, Price |
| Relationship | An association between entities | Diamond connected to the entities it relates | A customer orders a product |
Relationships can have attributes of their own. For example, in the Enrollment relationship between Student and Subject, the grade belongs neither to the student nor to the subject, but to the combination of both.
Entity types: strong and weak
- Strong entity. It exists on its own and is identified by its own attributes. Example: an Order, identified by its number.
- Weak entity. It depends on another entity (the strong one) to exist or to be identified. It is drawn as a double rectangle, and the relationship linking it to the strong entity as a double diamond. Example: an Order line: line 3 means nothing unless you know which order it belongs to. It is identified by the order's key plus its own line number (the discriminator or partial key).
Attribute types
Key attributes, which identify each entity:
- Superkey: any set of attributes that uniquely identifies each entity (for example, ID number + Name).
- Candidate key: a minimal superkey, with no attribute to spare (the ID number on its own).
- Primary key: the candidate key the designer chooses as the main identifier. It is drawn underlined.
Other attribute types:
- Composite: it breaks down into other attributes (Address = street + number + ZIP code).
- Multivalued: it can hold several values for the same entity (a customer's phone numbers). It is drawn as a double ellipse.
- Derived: it is calculated from others (age, from the date of birth). It is drawn as a dashed ellipse.
- Optional: it can be left empty.
A common point of confusion: the foreign key is not part of the ER model. In the diagram, the link between entities is expressed by the relationship; foreign keys appear later, when converting to the relational model.
Degree of a relationship
The degree is the number of entities taking part in a relationship:
- Degree 1 (recursive or unary): an entity is related to itself. Example: an Employee supervises other employees.
- Degree 2 (binary): two entities. This is the most common. Example: a Customer places an Order.
- Degree 3 (ternary): three entities at once. Example: a Customer orders a Product and an Invoice is issued.
- Degree N (n-ary): more than three entities. They are rare and often mean the design should be reviewed.
Cardinality
Cardinality tells you how many elements of one entity each element of the other can be related to. It is expressed in two complementary ways:
- Participation (minimum, maximum) of each entity in the relationship: (0,1), (1,1), (0,N) or (1,N). The minimum says whether participation is optional (0) or mandatory (1); the maximum, whether it is one or many.
- Relationship type, taken from the maximums on each side: 1:1, 1:N or N:M.
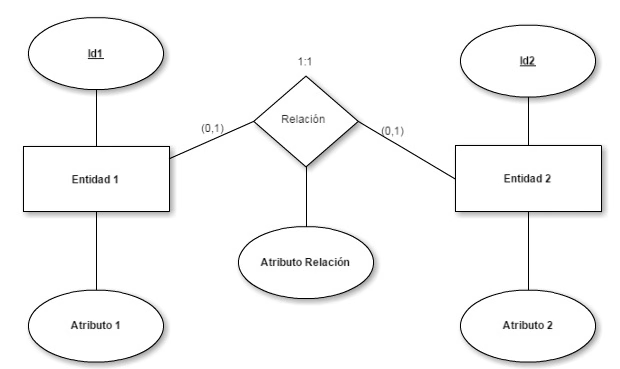
One-to-one (1:1)
Each element of the first entity is related to a single element of the second, and vice versa. Example: each Country has one Capital and each capital belongs to one country.
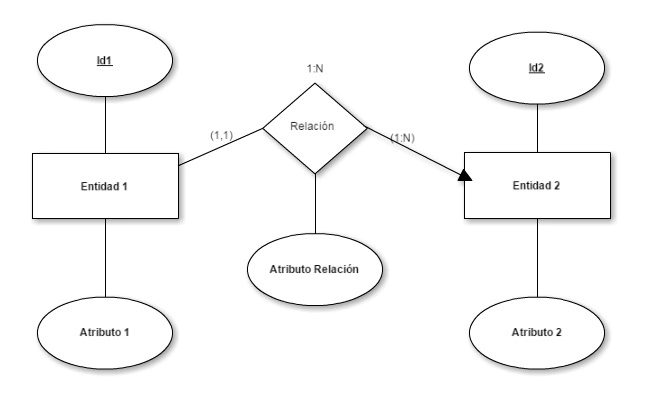
One-to-many (1:N)
Each element of the first entity is related to one or more elements of the second, but each element of the second is related to only one of the first. Example: a Customer places many Orders, and each order belongs to a single customer.
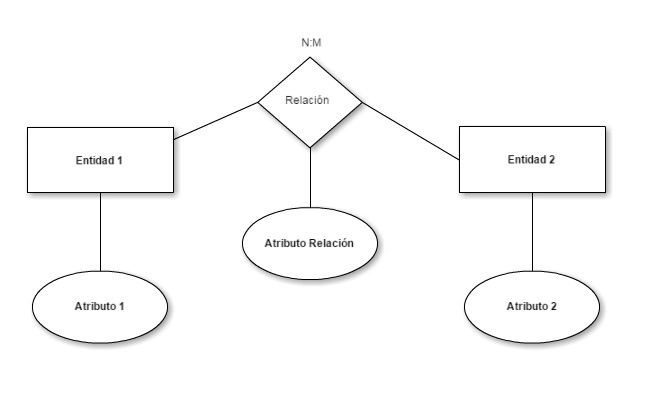
Many-to-many (N:M)
Each element of each entity can be related to several of the other. Example: a Student enrols in several Subjects and each subject has several students.
Cardinality is not a detail: it decides how each relationship will be turned into tables. For example, an N:M relationship always ends up as a table of its own. Each case is explained in how to convert an entity-relationship model to a relational database.
Generalization and specialization
Sometimes several entities share some attributes and differ in others. Instead of repeating them, they are grouped under a general entity (supertype) with subtypes hanging from it through an "is a" (IS-A) relationship, drawn as a triangle.
- The supertype holds the common attributes, which all subtypes inherit.
- Each subtype adds its own attributes.
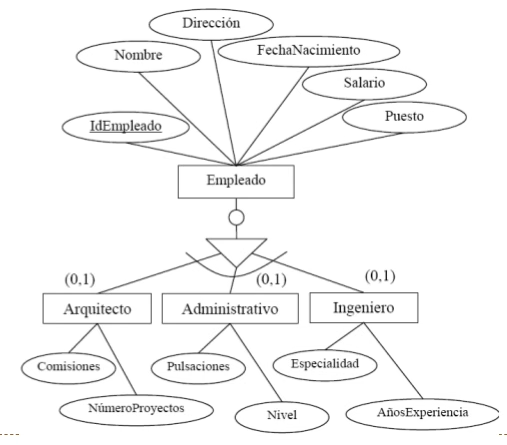
A generalization is classified by two independent criteria:
| Criterion | Type | Meaning | Example with Employee |
|---|---|---|---|
| Completeness | Total | Every element of the supertype belongs to at least one subtype | Every employee is an architect, a clerk or an engineer |
| Partial | Some elements may belong to no subtype | There may be employees in other roles | |
| Overlap | Disjoint | Each element belongs to at most one subtype | An employee cannot be both an architect and an engineer |
| Overlapping | An element can belong to several subtypes | An employee can be an engineer and an architect |
They combine freely: a generalization can be total and disjoint, partial and overlapping, and so on.
How to draw an entity-relationship diagram, step by step
- Identify the entities. Look for the key nouns in the problem statement: customer, product, invoice…
- Describe their attributes and decide which are composite, multivalued or derived.
- Choose the primary key of each entity.
- Establish the relationships between entities, with their degree and cardinality.
- Draw the diagram in the chosen notation, by hand or with a database tool.
- Check the result against the problem statement: make sure every piece of data has its place and that the diagram answers the questions the database will be asked.
For the whole process, from requirements to tables, see the guide to designing a relational database.
Full example: a print shop
This diagram models a print shop (Imprenta Umpiérrez S.L.) and brings together almost everything covered in this guide. The labels are in Spanish; their meaning is given below.
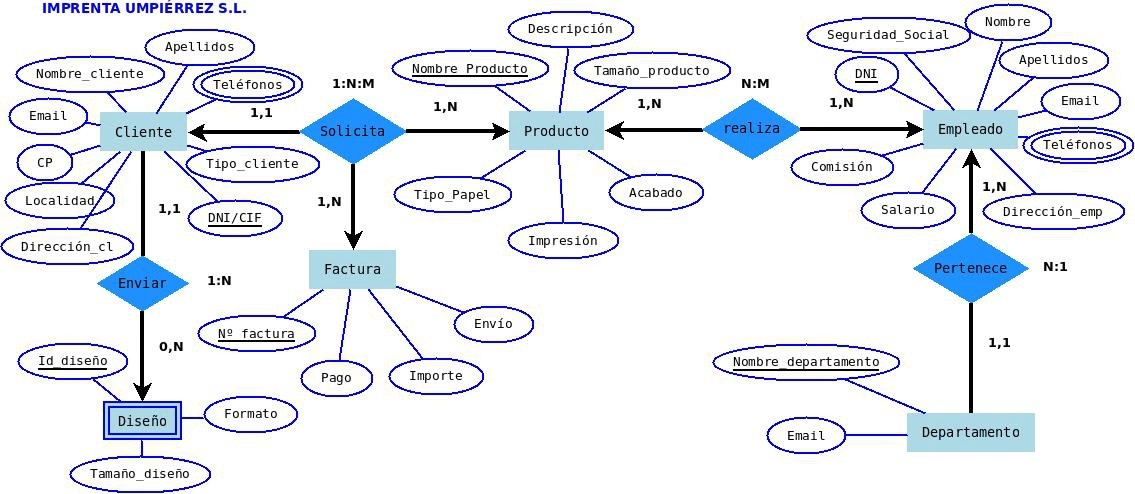
- Strong entities: Cliente (Customer), Producto (Product), Factura (Invoice), Empleado (Employee) and Departamento (Department), each with its primary key underlined.
- Weak entity: Diseño (Design), drawn as a double rectangle. A design only exists because a customer sent it.
- Multivalued attribute: Teléfonos (phone numbers), drawn as a double ellipse in Customer and Employee: each can have several.
- Ternary relationship: Solicita (Orders) links Customer, Product and Invoice (1:N:M): a customer orders products and each order generates an invoice.
- 1:N relationship: Enviar (Sends): a customer sends zero or more designs (0,N) and each design belongs to a single customer (1,1).
- N:M relationship: realiza (Works on), between Product and Employee: several employees work on a product and each employee works on several products.
- N:1 relationship: Pertenece (Belongs to): each employee belongs to one department, and a department has several employees.
A good exercise is to turn this diagram into tables using the rules for converting to the relational model.
Frequently asked questions
What is the difference between the entity-relationship model and the relational model?
The entity-relationship model is conceptual: it describes the problem with entities, attributes and relationships, without thinking about tables. The relational model is logical: it organizes that data into tables with primary and foreign keys, ready to be created in a database management system. The ER model comes first and is then converted into the relational model.
What is a weak entity?
An entity that cannot exist or be identified without another entity, called the strong entity. For example, an order line depends on its order. It is drawn as a double rectangle and its key is made up of the strong entity's key plus an attribute of its own, the discriminator.
What is cardinality in the entity-relationship model?
The number of elements of one entity that each element of the other can be related to. It is shown with the participation (minimum, maximum) of each entity and gives rise to the three relationship types: 1:1, 1:N and N:M.
Which tool can I use to draw entity-relationship diagrams?
Anything from general diagramming tools to dedicated database modelling software. You will find a comparison in database management tools.
This content started as notes for the Database Management module of a Spanish vocational course in network systems administration (ASIR). I revised, corrected and expanded it in 2026. If you are just starting out, continue with the introduction to databases.
0 Comments